NCEI Reports 2017 Was Costliest Climate Disaster Year at $306B

WASHINGTON — The National Centers for Environmental Information (NCEI) recently announced official findings of the economic effect of 2017’s climate disasters, ultimately concluding it was the costliest on record since it began assessing climate data in 1980.
The government organization, which monitors and assesses climate including tracking and evaluating climate disasters in the U.S. and worldwide “that have great economic and societal impacts, found that the overall cost of climate disasters in the U.S. in 2017 was $306.2 billion, overshadowing the previous costliest year by nearly $100 billion. The previous record was held by 2005, the year Hurricanes Wilma, Rita, Dennis, and, of course, Katrina hit the U.S. and costs reached an estimated $214.8 billion. The total cost of all climate disasters since 1980 is $1.5 trillion, and 2017 accounts for more than 20 percent of that total.
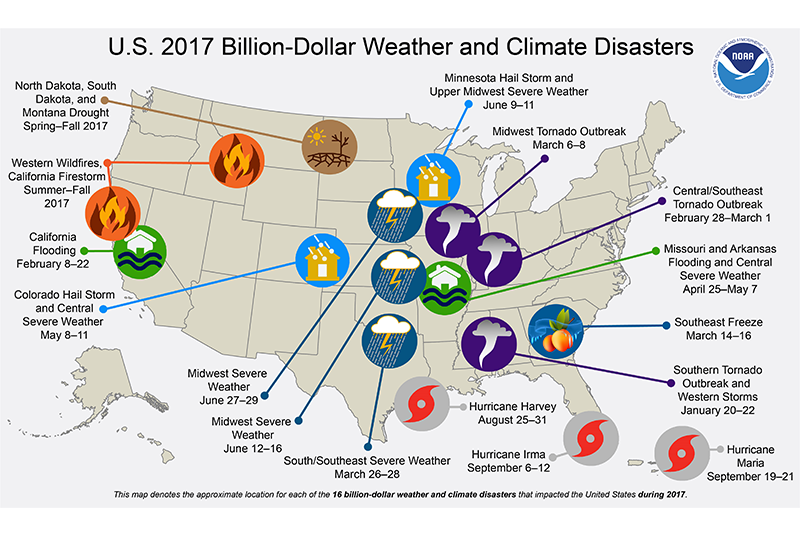
The NCEI focuses primarily on events where the overall damage costs are more than $1 billion. The U.S. experienced 16 of these billion-dollar climate disasters in 2017, tying the year with 2011, though that year’s total cost was far lower at less than $100 billion. And the NCEI says, “In fact, 2017 arguably has more events than 2011 given that our analysis traditionally counts all U.S. billion-dollar wildfires, as regional-scale, seasonal events, not as multiple isolated events.”
Excluding all disasters that caused less than $1 billion, of which there were many, the NCEI reported the following billion-dollar weather and climate disasters in 2017 (shown by location in the image above):
- Three tropical cyclones,
- One severe wildfire (all western wildfires from summer to fall are included here together),
- Eight severe storms,
- One severe drought
- Two severe floods
- One severe freeze.
From NCEI’s data, one can infer a rising average number of billion-dollar weather and climate disasters, as the annual average for the most recent five years stands at 11.6 yearly events, while the average for the data-collection period, 1980 to 2017, is far below at 4.8 events.
About these statistics:
NCEI says, “In performing these disaster cost assessments, these statistics were taken from a wide variety of sources and represent, to the best of our ability, the estimated total costs of these events — that is, the costs in terms of dollars that would not have been incurred had the event not taken place. Insured and uninsured losses are included in damage estimates. Sources include the National Weather Service, the Federal Emergency Management Agency, U.S. Department of Agriculture, National Interagency Fire Center, U.S. Army Corps, individual state emergency management agencies, state and regional climate centers, media reports, and insurance industry estimates.”
Read the full report from NCEI.


