The 2026 Restoration Benchmarking Survey Report

If last year’s survey painted a picture of an industry under pressure, the 2026 edition confirms that the pressure hasn’t let up—and in some areas, it’s become heavier. Insurance friction, cash flow strain, and the search for good labor continue to dominate contractors’ worry lists.
Real signs of resilience abound, too. Technology adoption is accelerating, most businesses are projecting growth, and water damage restoration remains the industry’s core profit engine.
This year’s survey drew from restoration and remediation contractors, full-service firms, and a growing contingent of mold assessors and indoor environmental professionals. Corporate management and owners represented nearly 79% of respondents, making this a genuine owner-to-owner look at the state of the business.
Challenges that won’t go away
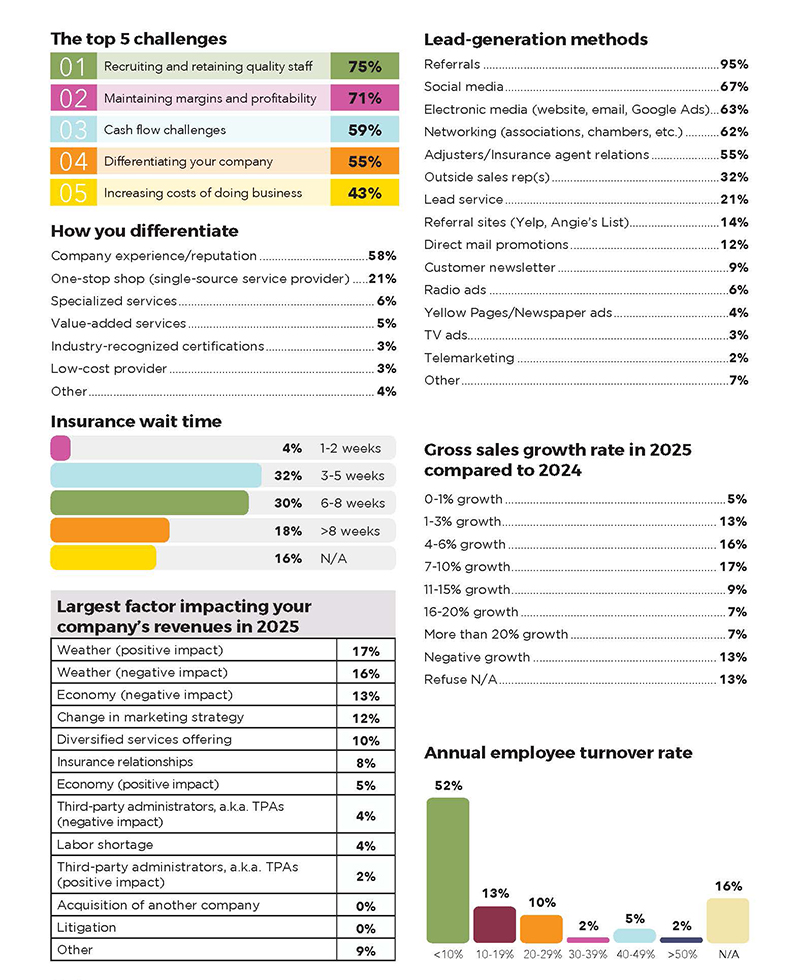
One notable shift from 2025: Maintaining margins and profitability moved to the top spot this year, edging past recruiting and retaining quality staff, which had held the No. 1 position the prior year. That inversion reflects a business environment where even contractors who have built solid teams are watching their margins tighten.
The open-ended responses make one thing unmistakably clear: Insurance companies are the industry’s most common antagonist. Contractors described a pattern of delayed payments, reduced scopes, and pressure tactics that leave them caught between doing the job right and getting paid for it.
A few had some concerns.
“Carriers holding up funds. It is severely holding up our cash flow and ability to operate.”
“Costs rising faster than Xactimate/Cotality price models.”
Cash flow scored a 4.36 weighted average as a top concern—and the payment wait-time data makes clear why. A little over 3% of respondents report receiving insurance payment within one to two weeks. The majority wait three to eight weeks, and over 18% wait more than eight weeks.
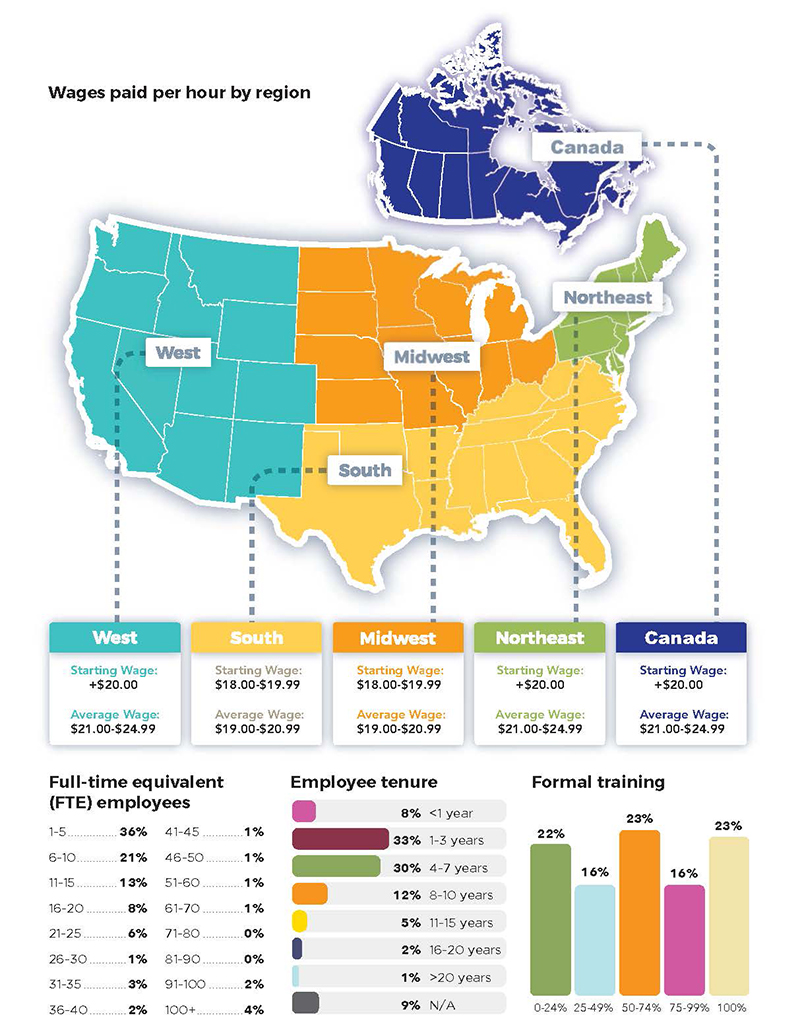
Labor may have dropped from the top position, but it still registers a 4.55 weighted average—essentially a tie with margins in terms of felt intensity. Starting wages have moved up, with the most common range now US$20–$21.99 per hour. Annual turnover shows a promising shift: 52% of respondents report under 10% turnover, up from 46% in 2025—evidence that investment in culture and retention paid off for those who’ve made it.
Profitability: margins split wide
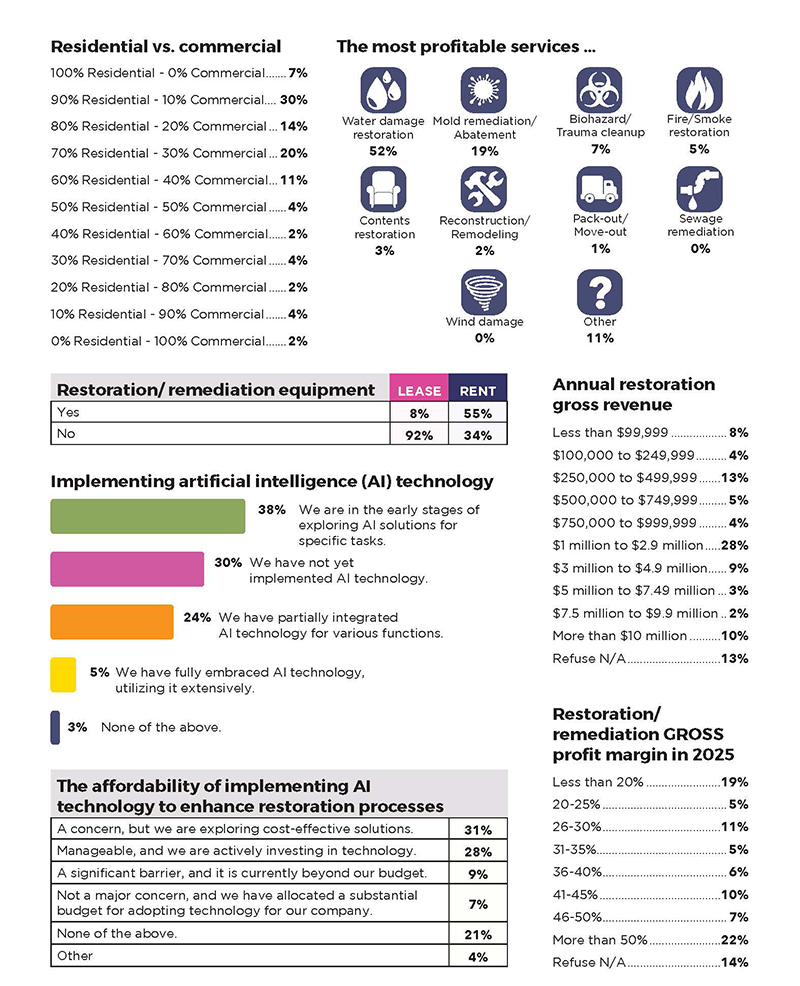
Water damage restoration remains the clear profit leader, cited by 52% of respondents as their most profitable service—up from 47% in 2025. Mold remediation ranked second at 19%. The residential-versus-commercial split continues to lean heavily residential, with the most common profile around 90% residential/10% commercial.
Gross profit margins tell a split story. About 19% of respondents reported margins under 20%—a danger zone for most business models—while 22% reported margins above 50%. The sub-20% figure is up from 12% in 2025, consistent with the finding that margin pressure has become the industry’s defining concern.
Xactimate® remains the dominant pricing tool at 66% of respondents. CotalityTM was used by 17%, suggesting gradual adoption as contractors explore alternatives.
Revenue and growth outlook
The largest annual revenue bracket was $1 million to $2.9 million, representing 28% of respondents. About 10% reported revenue over $10 million. On the lower end, 8% came in under $100,000.
Looking ahead, the outlook is cautiously optimistic. Approximately 31% of respondents project growth of more than 10%, 18% project 6–10% growth, and 26% expect 1–5% growth. Only 14% anticipate any decline. Nearly three-quarters of respondents expect to grow—a notable show of confidence given the operational pressures described elsewhere in the survey.
Technology and AI
The 2026 data showed an industry that has moved from skepticism to active experimentation with AI. In 2025, 50% of respondents said they had not yet implemented AI. In 2026, that number dropped to about 30%, with a little over 37% now describing themselves as in the early stages of exploring AI solutions and 24% reporting partial integration. Contractors are using AI for marketing content, estimate drafting, report writing, administrative efficiency, and standard operating procedure (SOP) development.
Cost perception is shifting fast. In 2025, many saw AI as cost-prohibitive. In 2026, 28% said the cost is manageable, and they’re actively investing, while only 9% still called it a significant barrier.
“We’re finding ways to leverage AI to create efficiencies within our current operations—mostly administrative functions.”
One respondent flagged a pressure point worth watching: carriers using AI to dispute scope and pricing. As AI-assisted claim review becomes more common on the carrier side, contractors without strong documentation technology may find themselves at a compounding disadvantage.
How contractors win business
Referrals remain the overwhelmingly dominant lead source at 93%, nearly unchanged from 95% in 2025. One notable drop: adjuster and insurance agent relationships registered at 55% this year, down from 68% in 2025. That may reflect both the adversarial insurance climate and a deliberate shift by some contractors away from insurance-dependent pipelines.
Experience and reputation remain the primary differentiator for almost 58% of respondents. Low-cost provider was essentially negligible as a self-reported differentiator, consistent with near-universal concern about competing with companies that race to the bottom on price.
The bottom line
The 2026 survey captures an industry that is simultaneously pressured and opportunistic. Margins are tighter, insurance relationships are more contentious, and the cost of doing business keeps climbing. But contractors who are investing in technology, documentation, and workforce development are finding advantages, and most expect to grow.
The major shifts from 2025 tell a story in themselves: AI adoption accelerated sharply, margin pressure overtook staffing as the top concern, water damage profitability consolidated further, adjuster relationship marketing declined, and employee turnover improved. Taken together, these moves suggest an industry that is professionalizing under pressure—not retreating from it.
For contractors benchmarking their own operations against these results, the data offers both reassurance and a challenge. Reassurance that the pressures you feel are real and widely shared. A challenge to measure whether your margins, wages, technology stack, and growth projections put you ahead of or behind where your peers are landing.
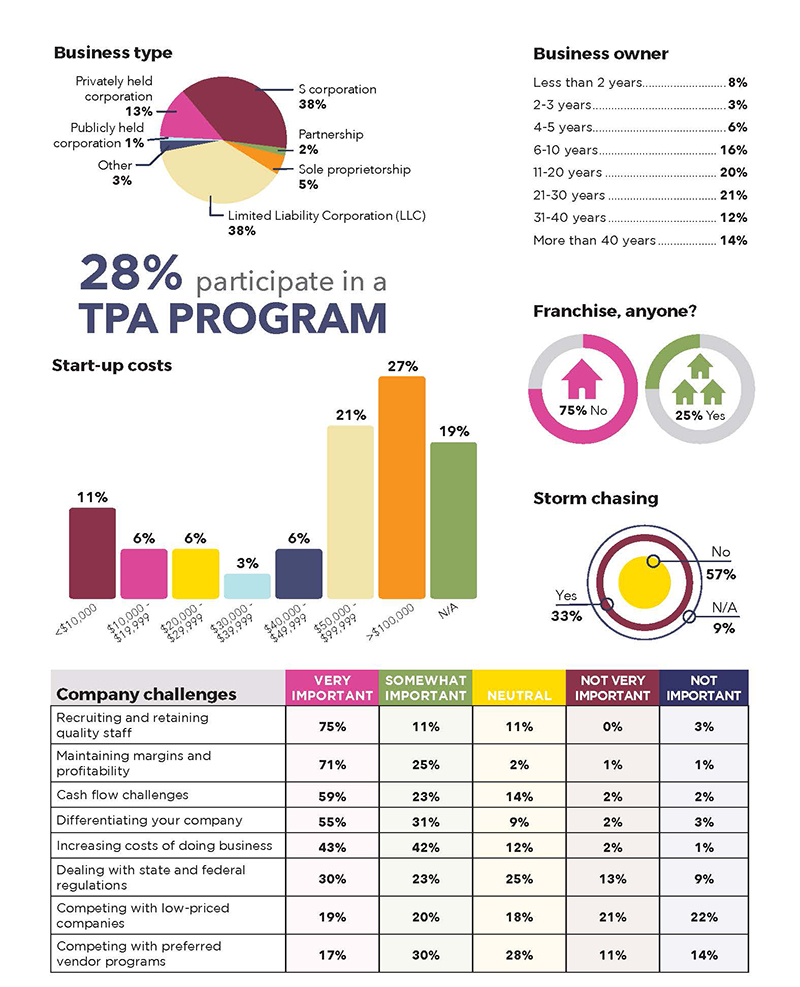
About this report: The data recorded in this survey is based on answers from restoration contractors and industry professionals who responded to invitations to participate. Results are not necessarily based on audited financial statements.

Jeff Cross
Jeff Cross is the ISSA media director, with publications including Cleanfax, Cleaning & Maintenance Management, and ISSA Today, as well as multimedia programs such as Straight Talk! and Take 5 With Cleanfax in video and podcast format. He can be reached at [email protected].