The Marketing Benchmarks Carpet Cleaning Was Missing
Every home-service benchmark report I have ever read was written about somebody else’s business.
ServiceTitan® publishes call-booking rates across heating, ventilation and air conditioning (HVAC), plumbing and electrical shops.
Invoca publishes what happens on 70 million inbound calls for home services as a category.
Jobber® surveys a thousand owners a year, and cleaning is one line in the results.
The data is good. But none of it is about a two-truck carpet cleaner in a mid-size market, and if you are that cleaner, reading it is like reading someone else’s bank statement to figure out your own.
Cleanfax’s annual Carpet and Floor Cleaning Benchmarking Survey is the one place the carpet and floor side of home services is asked anything, and it covers what it costs to run the business: pricing, labor, supplies, competition and technology.
But nobody was covering the other half, which is what happens between the phone ringing and the customer coming back. Booking rate. Speed to lead. Average ticket. Protectors. Repeat rate. Lifetime value. Revenue per truck.
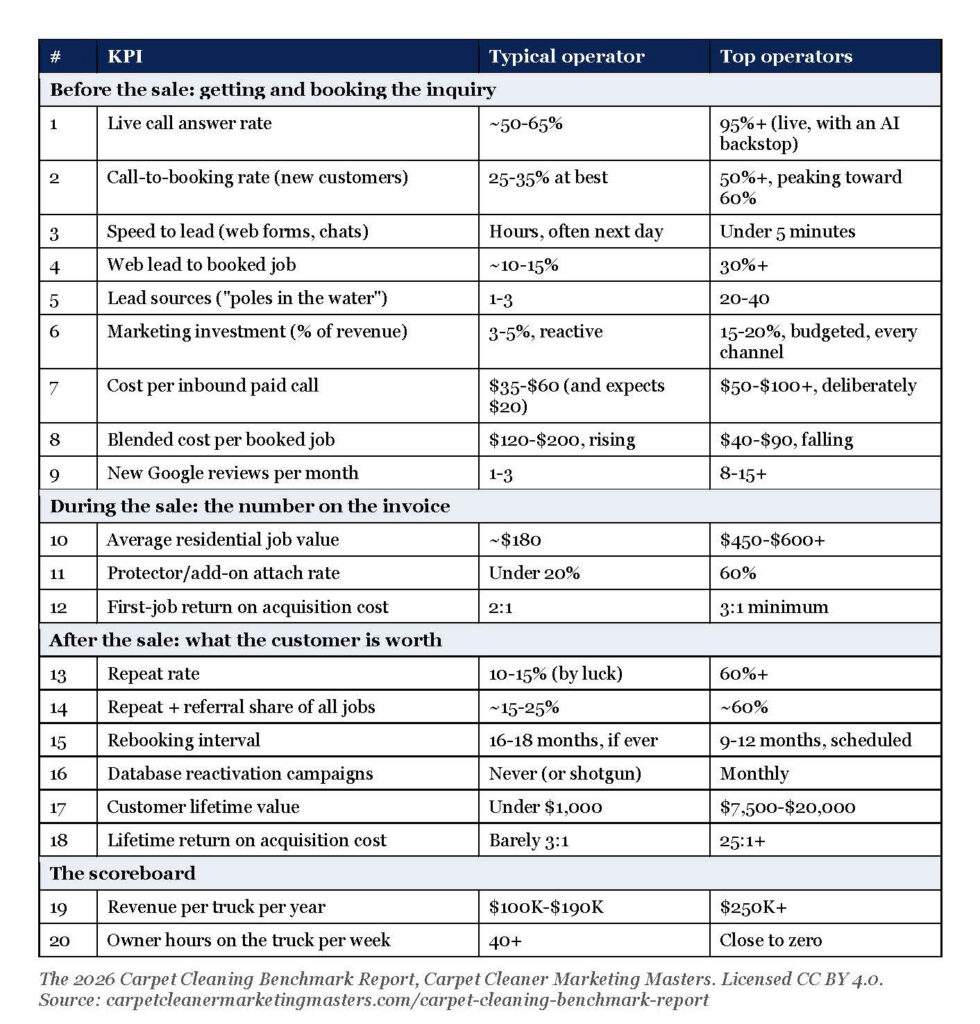
So, we built it. The 2026 Carpet Cleaning Benchmark Report is 20 operating numbers for residential carpet cleaning. This piece is about the decisions behind it because the decisions are where the usefulness is.
Decision one: two columns, not one
The obvious way to build a benchmark table is one column: the industry average. We did not do that, because an average describes nobody. It blends the cleaner who answers half his calls with the one who answers all of them, and reports back a number neither of them can use.
Every row in the report has two ranges instead: what a typical operator runs and what the top operator in a market runs. Not the national elite. The best-run company in your town, with the same trucks and the same phone.
The gap between the two columns is the information. A typical cleaner books 25-35% of new-customer calls; a top operator books 50% and pushes toward 60%. A typical residential job is around $180; a top operator’s is $450-$600 or more. A typical repeat rate is 10-15%, mostly by luck; a top operator’s is 60% or better. Put those side by side, and the owner does not need a consultant to tell him where he stands. He can find his column.
Decision two: ranges, stated plainly, not a survey dressed up as one
This is the part I want to be straight about, because it is on the report page and it should be here too.
There is no respondent sample behind these numbers. They are operator-experience benchmarks: thirty-five years running cleaning businesses and the hundreds of carpet and home cleaning companies we have coached and run marketing for, with their booking rates, ticket averages, repeat rates and cost per lead in front of us. “Typical” is the range most of those companies are in when we first see their numbers. “Top operators” is the range the best-run ones actually hold. It is a real range because there are real companies in it.
We set one rule for sourcing and kept it. Where a real outside dataset exists for a row, we anchored to it and named it: Invoca’s finding that only about 52% of inbound home-service calls get a live person; ServiceTitan’s data that shops under five techs book 24% of calls; Hatch’s analysis of 132,000 follow-up campaigns showing 88% of contractors take longer than five minutes to respond to a lead; Angi’s $183 national average ticket; Chem-Dry’s own franchise disclosures showing a $449 average job in a premium-positioned system. Where no such data exists, the range is ours, and the page says so. The “carpet cleaning industry statistics” articles that rank on Google right now are mostly unsourced content-farm numbers. None of them are in the report.
I would rather publish an honest range than a fake decimal point. A 2027 edition built on submitted operator data is in progress. Until then, if your numbers differ from ours, good. Measure them. The table is not meant to be argued with. It is meant to be beaten.
Decision three: the order of the rows is the growth plan
The twenty rows are grouped before the sale, during the sale, after the sale, and the scoreboard. That is not a filing system. It is the order the numbers get fixed in.
Before the sale, there is intake: answer rate, booking rate, speed to lead. These move fastest and cost the most per day ignored. A cleaner who fixes only these, answering 95% of calls instead of 60% and booking half instead of a third, usually adds more revenue in ninety days than any ad campaign he has ever run, with the same ad spend.
During the sale, there is the invoice. Package pricing moves the average job from $180 to $450-plus and takes protector attach from under 20% to 60%, without a hard sell, because the packages do the asking.
After the sale is what the customer is worth. A one-and-done customer is worth under $1,000. A customer on a scheduled 9-to-12-month cadence with a monthly database program is worth $7,500 to $20,000. This is the row most owners have never measured, and it is the one that changes how every row above it looks. When a customer is worth $10,000, spending $165 to acquire one is not a cost.
Fix them in that order and the math compounds. Double the ticket, double the lifetime value, then add leads to an engine that answers, books, upsells and brings people back. Most cleaners try to buy their way to growth with leads first, and the leads land in a business that does not answer the phone.
The row that starts arguments
One row in the report is deliberately counter-intuitive, and it is the one I would put in front of every owner who thinks marketing is a cost.
The typical operator pays $35-$60 per inbound paid call and thinks $20 would be fair. The top operator pays $50-$100 or more per call, on purpose. And the top operator’s blended cost per booked job is $40-$90 and falling, while the typical operator’s is $120-$200 and rising.
The cleaner paying the most per call has the lowest cost per customer. That is not a paradox. It is the intake numbers doing their job. When you answer the call, book half of them, and respond to web leads in five minutes, an expensive call is cheap. When you do not, a cheap call is the most expensive thing you buy.
Why it is free to reproduce
The report is published under a Creative Commons license, CC BY 4.0. Any publication, association, supplier or software company in this industry can reproduce the table, in whole or in part, with attribution. We did that because a benchmark nobody can share is a benchmark nobody uses, and because I want it argued with by people who have better data than I do. If that argument produces a better table in 2027, the industry wins.
What to do with it this week
You do not need a dashboard with 20 gauges. Start with three numbers, daily: calls answered, calls booked, and how long it took to respond to the last web lead. Write them on a whiteboard. In 30 days, you will know which column you are in, and you will know it before your competitor does.

John Clendenning
John Clendenning has been in the carpet cleaning and cleaning service industry for more than 30 years. He is the founder of Carpet Cleaner Marketing Masters and the Author of The Complete Guide to Internet Marketing for Carpet Cleaners (available on Amazon.com). If you would like more information, contact him via his website at CarpetCeanerMarketingMasters.com.