The Restoration Pulse: Monitoring Dehumidifier Performance With an Alternative Method
In the restoration industry, accurately assessing dehumidifier performance is essential for ensuring efficient drying and successful project outcomes. Yet traditional evaluation techniques can sometimes overlook key variables that influence real-world results. As equipment technology evolves and environmental conditions grow more complex, professionals are seeking new methods that provide clearer, more reliable insights into how their machines are truly performing on the job.
The traditional method: grain depression
For years, the restoration industry has evaluated dehumidifier performance using a method referred to as “grain depression.” In simple terms, grain depression compares how much water vapor is in the air before it enters the dehumidifier with how much is left in the air after it leaves. The measurement represents the difference, expressed in grains per pound (GPP). One pound is equal to 7,000 grains, so GPP is just a way to describe the actual weight of moisture carried by a pound of dry air.
That traditional method has some value because it can provide a quick and simple verification that the dehumidifier is removing water. The problem is that it depends heavily on two sets of field readings to calculate GPP: the temperature and relative humidity entering, and the temperature and relative humidity leaving a dehumidifier. Relative humidity is a percentage of how full the air is compared with how much moisture it could hold at that temperature. Because warm air can suspend more moisture than cool air, a small error in the relative humidity reading—especially at the hotter outlet side of a dehumidifier—can turn into a much larger error when converted to GPP.
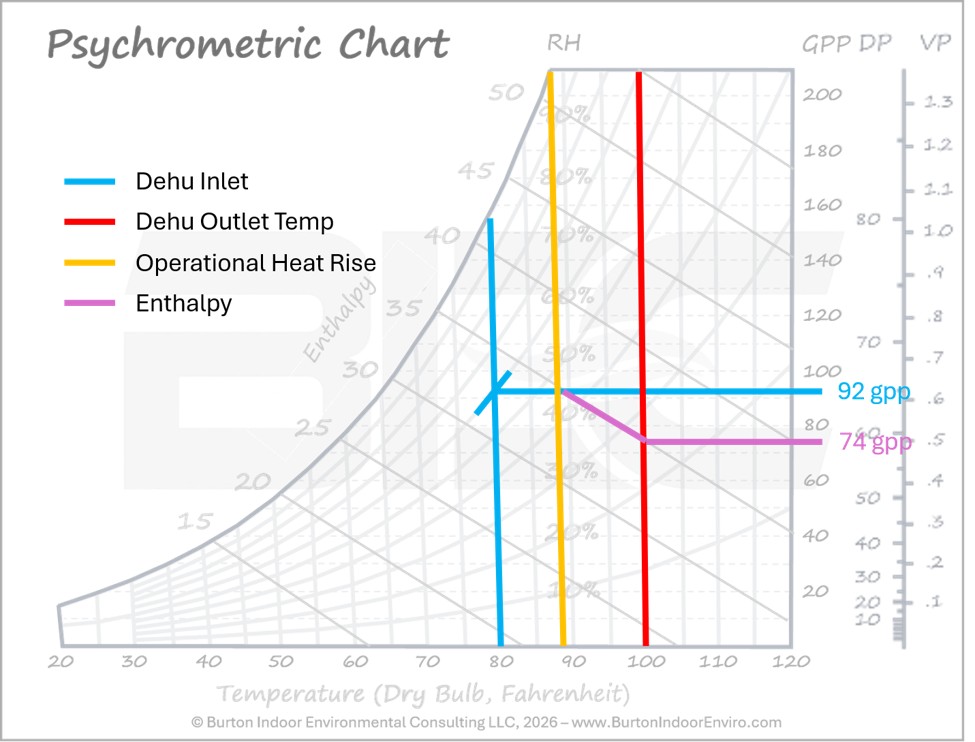
See the example below in Figure 1. A dehumidifier with an outlet condition of 100oF and 20% relative humidity (RH) is plotted on this chart (red lines). Because the hygrometer’s range is +/- 3% RH, measured RH could be as high as 23% or as low as 17%. That translates to 49-66 GPP, a huge range, especially when trying to understand the dehumidifier’s grain depression.
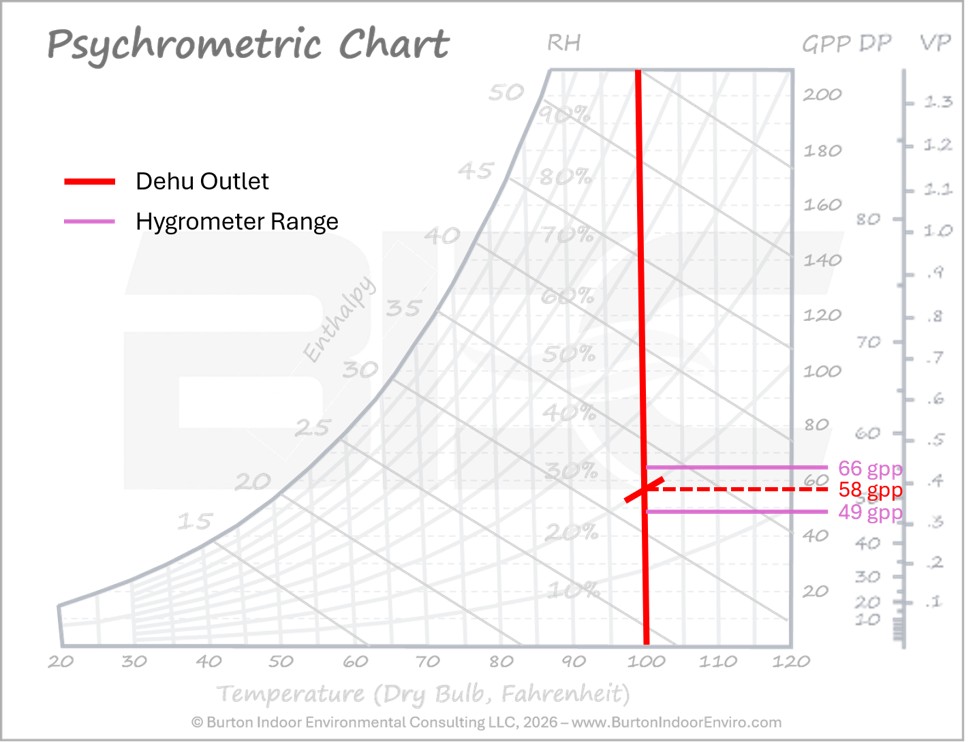
Figure 1: Psychrometric chart.
A better method: Enthalpy
A better way to evaluate dehumidifier performance is to understand and apply a simple additional term in the world of psychrometry and thermodynamics: enthalpy. In simple terms, enthalpy is the true total heat content of air. It represents not only the heat you can feel (i.e., “sensible” heat) but also the heat you cannot directly feel (i.e., latent heat). It’s an important and valuable term in the world of dehumidification. When a dehumidifier condenses water and turns it into a liquid (water removal), the latent heat that water possessed is converted to sensible heat. This is the primary reason the air leaving a dehumidifier is hotter than the air that entered.
In short, if you have a significant temperature rise across a dehumidifier, you are achieving water removal. Further, it’s not at all difficult to use that temperature rise to calculate the actual water removal; and the process is far more accurate than grain depression.
To apply an enthalpy method for evaluating dehumidifier performance in the field, the technician does not need to become a thermodynamics expert. The method uses readings a technician can capture with significant accuracy:
- Inlet temperature (common meters used to measuring temperature in the restoration industry are highly accurate)
- Inlet relative humidity (at a more reasonable, cooler temperature common at the inlet, a difference of relative humidity has far less impact on accuracy)
- Outlet temperature (again, temperature meters are generally very accurate)
- Amp draw (measured; rated amps on the serial label can be used but will be less accurate)
- The dehumidifier’s airflow, or cubic feet per minute (CFM, generally available from manufacturer websites or specifications in manuals).
The key to applying the method is to understand that heat is added to the air in two parts. Some heat is produced because the machine is running; this is why we need amp draw. The heat added from running or operation is mostly dependent on the amount of power the dehumidifier is consuming. The balance of the temperature rise observed is added as water vapor changes back into liquid water inside the dehumidifier.
Step 1: Estimating operational heat rise
Temperature rise from operation = (amps x volts x 3.4) / (1.08 x CFM)
Simplified = (346 x amps) / CFM
This first calculation estimates how much warmer the air becomes simply because the dehumidifier is consuming electrical power. For example, a unit drawing 10 amps on 110 volts at 425 CFM produces: (10 amps x 110 volts x 3.4) / (1.08 x 425 CFM) = 3,750 BTU/hour / 459 = 8.16°F of temperature rise from operation alone. The simplified version of the formula assumes 110-volt equipment and provides a quick and easy way to make the estimate.
For most dehumidifiers, the temperature rise from operation will be between 8 and 10 degrees Fahrenheit – you can use that to keep the math simple and skip this first step, although calculating your actual temperature rise will be more accurate.
Step 2: Chart the readings
Using a psychrometric chart, apply the readings obtained in the first step. For this example, let’s say we have an inlet condition of 80oF at 60% RH. Begin by applying the inlet temperature and RH onto the Chart (Figure 1, Blue lines) and extend those lines to calculate the inlet GPP (approximately 92 GPP). Next, apply the outlet temperature from the dehumidifier to your chart (Figure 1, Red lines). For this example, we’ll use an outlet temperature of 100oF. You’ll only need the temperature for this red line.
Now that we have the inlet and outlet plotted, let’s work with enthalpy. First, plot the temperature rise from operation. If we use the example from step 1 and 2, we will have an operational temperature rise of approximately 8oF. With an inlet temperature of 80, that means we are plotting a temperature of 88oF (yellow line).
Now comes the magic. Plot the rest of the temperature rise using the enthalpy line. It’s the diagonal line running across the middle of the chart (purple line). Begin this line from your operational heat rise, where it crossed the blue plotted GPP line. Follow that line down and to the right. Where it crosses your outlet temperature (red line), move straight to the right. This is a very accurate calculation of your outlet GPP (74).
What the psychrometric chart adds
A psychrometric chart is simply a map of air, heat, and moisture. It shows how temperature, relative humidity, GPP, vapor pressure, and heat content relate to each other. A technician does not need to memorize every line on the chart to benefit from it. The important idea is that a dehumidifier changes the condition of the air in a predictable way: air enters, moisture condenses on the coil, and air leaves typically drier and warmer.
Enthalpy is one of the chart’s more intimidating words, but the concept is straightforward. Enthalpy is the total heat contained in the air, including the heat you can feel as temperature and the hidden heat tied up in water vapor. In drying work, this matters because a dehumidifier does not only change humidity, it also moves heat around as water changes state. Reading the process on the chart helps convert that change into water removal in a practical and highly accurate way.
A more reliable dehumidifier performance measurement
Dehumidifier performance is a critical metric to evaluate and document in the water damage restoration process. The typical ‘grain depression’ method, however, is problematic as it relies on measurement of relative humidity at a high temperature, something most handheld meters struggle to do with a high degree of accuracy. By understanding how to leverage enthalpy and a psychrometric chart, the evaluation can be made much more accurate.
Practice this method, and dehumidifier performance measurement will become much more reliable in your field documentation. In general, the habit of using a psychrometric chart will help you better understand and master the realities of managing a drying environment, as the chart expresses the relationship between the conditions you are trying to control to support drying.

Brandon Burton
Brandon Burton, a longtime industry advocate, trainer, and standards volunteer, brings more than 30 years of experience on the technical side of the restoration industry. He is an approved IICRC instructor and a published author in the field. Burton currently serves as chair of the ANSI/IICRC Standards Committee and vice chair of the ANSI/IICRC S500 Standard for Professional Water Damage Restoration.